Improve Memory for Your Rails App
Rails 应用的内存优化
I was in Zhengzhou today for the two-day Ruby Summit China 2018; the Summit was held at the "Big Corn" in Zhengzhou. I didn't expect that a city like Zhengzhou, where the density of Internet companies is not that high, could host an Internet conference of this scale (Ruby Summit was just one of the sessions). What was even more surprising was that the father of the Ruby language, Yukihiro Matsumoto (Matz), was also here to give the opening speech. So I came all the way from Shanghai to Zhengzhou to attend this Summit - a kind of star-crossed behavior in the programmer world. I sat in the first row early and managed to get a photo with Matz.
On the afternoon of the first day of Summit, a Ruby engineer from Boohee.com shared his experience in memory tuning for Ruby applications. I found the topic of memory very interesting and took some notes while listening to the sharing. I'm going to break this topic down into three parts, from easy to hard, and briefly analyze them.
Rebooting Is Good
There always seems to be an impression that Rails apps have always had memory leaks. As a Rails app runs longer, it consumes more and more memory.
A brute force solution is to periodically restart the Rails server worker, for example unicorn or puma have corresponding killer gems that kill the worker when memory is consumed to a certain level.
Unicorn: unicorn-worker-killer
Puma: puma_worker_killer
But the reality is that both Ruby and Rails have been working on memory optimization. In Ruby Summit's Keynote: Ruby after 25 years, Yukihiro Matsumoto himself talked about GC and Heap and finding different ways to optimize Ruby's performance. If our application has memory problems, we need to start solving those problems instead of just using worker killer.
So, how should we determine where the problem is?
Research and Learning
Our memory problems may differ at different stages of a Web App's operation. In simple terms, we can divide it into two phases: the start-up phase of the App, when various dependent gems are loaded and many objects are initialized, and the runtime phase of the App, which involves receiving requests, querying and organizing data, and returning results.
Booting Phase
In the boot phase of the App, we can use derailed_benchmarks to see how much memory each gem takes up during the initialization phase. It is simple to use:
# Gemfile
gem 'derailed_benchmarks', group: :development
gem 'stackprof', group: :development
# bash
$ bundle exec derailed bundle:mem
You may see results like this:
TOP: 25.1094 MiB
  rails/all: 33.3594 MiB
    rails: 12.0938 MiB (Also required by: active_record/railtie, active_model/railtie, and 8 others)
      active_support: 5.6875 MiB (Also required by: active_support/railtie, active_support/i18n_railtie, and 14 others)
        active_support/logger: 4.3125 MiB
          active_support/logger_silence: 4.1875 MiB
            concurrent: 4.1094 MiB (Also required by: sprockets/manifest)
Alternatively, there is a leaky gem list on Github that you can also refer to replace gems that have memory leaks.
Running Phase
During the running phase, we can use another gem oink to see what kind of requests are taking up too much memory and locate what might be going wrong.
oink has not been maintained for several years but is still working. The way it works is that it is inserted into the Rails App as a middleware to monitor memory usage. At the same time, it logs memory usage in a log, and it provides a CLI to aggregate these logs to help you identify the actions that consume the most memory.
# Gemfile
gem "oink"

# config/application.rb
module YourRailsApp
  class Application < Rails::Application
    config.load_defaults 5.2
    config.middleware.use Oink::Middleware
  end
end
After the application has been running for a while, run its CLI to see the statistics:
$ oink --threshold=75 /tmp/logs/*
You may see outputs like this:
---- MEMORY THRESHOLD ----
THRESHOLD: 75 MB

-- SUMMARY --
Worst Requests:
1. Feb 02 16:26:06, 157524 KB, SportsController#show
2. Feb 02 20:11:54, 134972 KB, DashboardsController#show
3. Feb 02 19:06:13, 131912 KB, DashboardsController#show

Worst Actions:
10, DashboardsController#show
9, GroupsController#show
5, PublicPagesController#show

Aggregated Totals:
Action                                  Max     Mean    Min     Total   Number of requests
SportsController#show                   101560  19754   4       5590540 283
CommentsController#create               8344    701     4       253324  361
ColorSchemesController#show             10124   739     4       68756   93
The last release of oink was in 2013, and although it is still available, we may still need a more aggressive product to replace it, such as various APM products.
After finding out which action is having memory problems, we can use memory_profiler to analyze the memory usage. This is a steadily updated gem, with new versions being released all the time.
Memory Master
After locating the problem code, it's mostly easy to fix it if it's our own hand-written code. But the situation is when the business just has that need and it involves the framework or even the system setup, we have to use more advanced methods.
Tuning GC
The Ruby language itself has quite a few memory settings based on environment variables, as you can see in Ruby's GC documentation. But wonderfully, I only saw a description of these variables in the Japanese version of the documentation, but not in the English version.
As a few examples, Ruby's GC has these settings:
- RUBY_GC_HEAP_INIT_SLOTS (default: 10000) - The number of slots initially allocated.
- RUBY_GC_HEAP_FREE_SLOTS (default: 4096) - This number of free slots is always allocated after GC. That is, if there are not enough free slots after GC, a new page is allocated to increase the number of free slots.
- RUBY_GC_HEAP_GROWTH_FACTOR (default: 1.8) - In Ruby, the size of allocated slots is increased by this factor every time a new slot is allocated. This means that the total number of slots increases exponentially. This is a mechanism to quickly reach the number of slots the running Ruby program requires.
As for how to optimize the GC parameters, you need to configure them in conjunction with the system you are running on. In this regard, there is even a SaaS service TuneMyGC to help people implement Rails GC optimization.
Memory Fragment
On the other hand, is it true that all memory growth in a Rails App at runtime is Memory Leak? Is it possible that it's Memory Bloat?
This is where the problem of Memory Fragmentation comes in.
Ruby's VM is essentially a two-stack machine, and we may run into this problem.
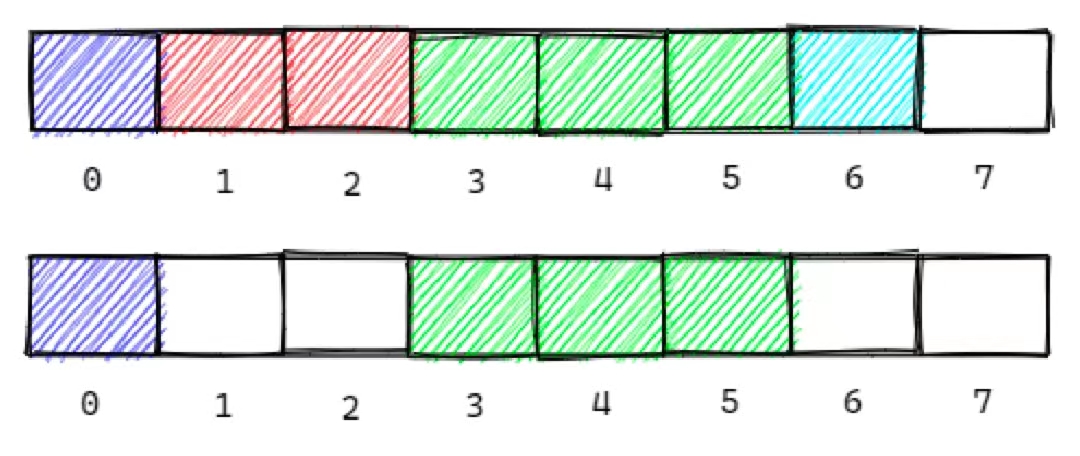
Out of the 8 slots allocated, we have freed up Slots 1, 2, and 6, and now we need to allocate a block to occupy 4 slots. We have to allocate new slots, and the original heap page may not be freed efficiently in the end. This is the problem of memory fragmentation.
There is a relatively simple solution, which is to use jemalloc.
The author of gem sidekiq, a background task commonly used in Rails, wrote in one of his articles Taming Rails memory bloat , mentions that after using jemalloc instead of malloc, the memory of sidekiq has improved significantly.
The results have been described as “miraculous”. That’s 40GB worth of Sidekiq processes shrunk to 9GB, a 4x reduction.
The use of jemalloc is also relatively simple, as we first need to install it at
# Mac
brew install jemalloc

# Linux
apt-get install -y libjemalloc-dev
Add --with-jemalloc when compiling Ruby (RVM can add --with-jemalloc directly after rvm install 2.x.x, rbenv should specify the environment variable RUBY_CONFIGURE_OPTS='--with-jemalloc' rbenv install 2.x.x); After that, when running Ruby, we simply do this:
$ MALLOC_CONF=stats_print:true ruby -e "puts RbConfig::CONFIG['MAINLIBS']"
These are my rather superficial notes, covering some of what I know. If you need to go deeper, you will need to study each of the smaller topics in depth.